If the essence of a taco can be distilled into the tortilla, filling, and salsa, so the essence of baseball can be distilled into pitching, offense, and defense. There’s no better way to preview the National League Division Series between the Dodgers and the Mets than by focusing on this triumvirate.
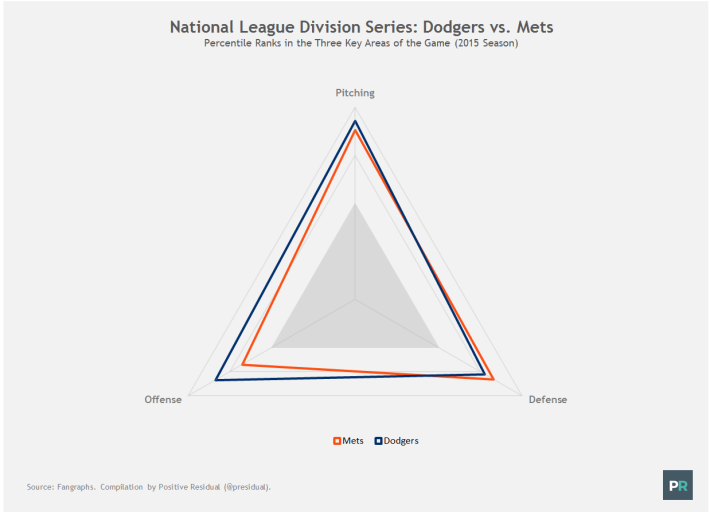
The following chart summarizes the teams’ season performances on the mound, at the plate, and with the glove. The closer they are to the corners of the triangle, the better their numbers. As we can see, although the Dodgers (blue) and the Mets (orange) are fairly evenly matched, the former seems to be marginally ahead overall.
During the regular season, Dodger pitchers amassed 22.5 Wins Above Replacement, placing them in the 93rd percentile of the entire majors. They were led by Clayton Kershaw and Zack Greinke, whose combined 14.5 WAR ranked among the top 12 pitching duos since the Cy Young Award was established in 1956. The much maligned bullpen had a subpar 3.91 earned run average, but they made up for it by being the only reliever corps to strike out more than 25 percent and walk less than 10 percent of the batters they faced.
Met pitchers were close behind with 20.9 WAR. Where they may have lacked in historic performances, they compensated with rotation depth. Their frontline starters Jacob deGrom, Noah Syndergaard, and Matt Harvey (who returned from Tommy John elbow surgery and will have his workload closely monitored) each had over 3 WAR, and they all cracked the top 25 in fielding independent pitching. Altogether, the Mets’ pitching unit had a penchant for pounding the strike zone, as it allowed the second lowest walk rate while boasting the third highest average fastball velocity (93.4 MPH).
On offense, the Dodgers held a more noticeable advantage. They created six percent more runs than average, fuelled by a combination of patience (highest walk rate and on-base percentage in the National League) and power (most home runs and second highest isolated power numbers). Their Achilles heel was baserunning, but they turned it around in August and September. During this time period, for example, they generated over 2.5 runs above average on stolen bases.
Photo by Dinur.
Met hitters had a turnaround of their own, as they overcame a paltry 7.5 WAR in the first half and accumulated an NL-leading 16.9 WAR in the second half. Yoenis Cespedes, who joined the team at the July 31 trade deadline, produced 57 percent more runs than average, prompting some fervent (though questionable) comparisons to former Dodger Manny Ramirez. But he was far from the only catalyst. Curtis Granderson was equally productive, while Lucas Duda, Michael Conforto, and Travis d’Arnaud were worth over 25 percent above average, albeit in limited appearances. Momentum may not be a determinant of playoff success, and the recent offensive surge is likely unsustainable, but the Mets' offense is certainly a different and more formidable unit than what the Dodgers encountered earlier in the year.
Defensively, the Mets had a slight edge, according to advanced metrics based on Ultimate Zone Rating. Note, however, that these numbers struggle to account for defensive shifts (a strategy that teams are increasingly using), which might undervalue the Dodgers’ overall fielding performance. Indeed, as Baseball Info Solutions estimated, the Dodgers saved more runs from the shift than the Mets did, while committing the fewest errors in the majors. So the two clubs might be more on par with each other than the data suggest.
Overall, the Fangraphs Playoff Odds give the Dodgers a 61% chance of winning the series. Betting markets largely concur. If the baseball postseason is often marked by randomness, Angelenos can only hope that the numbers prevail.


