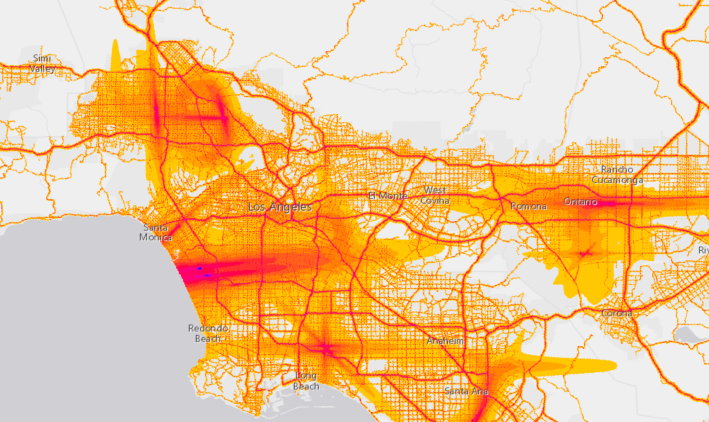
Most neighborhood noise complaints involve things like loud music on too late at night, or too early in the morning, barking dogs that simply refuse to stop no matter the time of day, or couples having loud fights in the apartment upstairs. But what about road and airplane noise? It's something that ends up adding to the ambient sounds of the city, but it does affect you and it is something that can drive some people crazy and hurt your quality of life. If you're interested in finding out the relative levels of noise caused by transportation in your area, the National Transportation Noise Map is the resource you'll want to check out.

Created by the US Department of Transportation, there are some disclaimers on how you want to interpret this data:
The National Transportation Noise Map is developed using a 24-hr equivalent sound level (LEQ, denoted by LAeq) noise metric. The results are A-weighted noise levels that represent the approximate average noise energy due to transportation noise sources over the 24 hour period at the defined receptors. This map includes simplified noise modeling and is intended for the tracking of trends, it should not be used to evaluate noise levels in individual locations and/or at specific times.
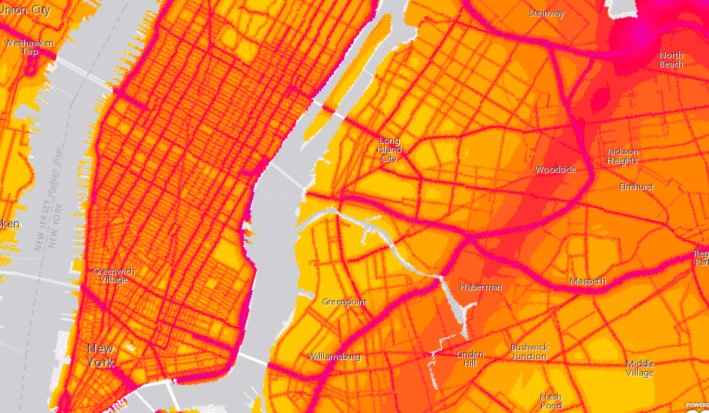
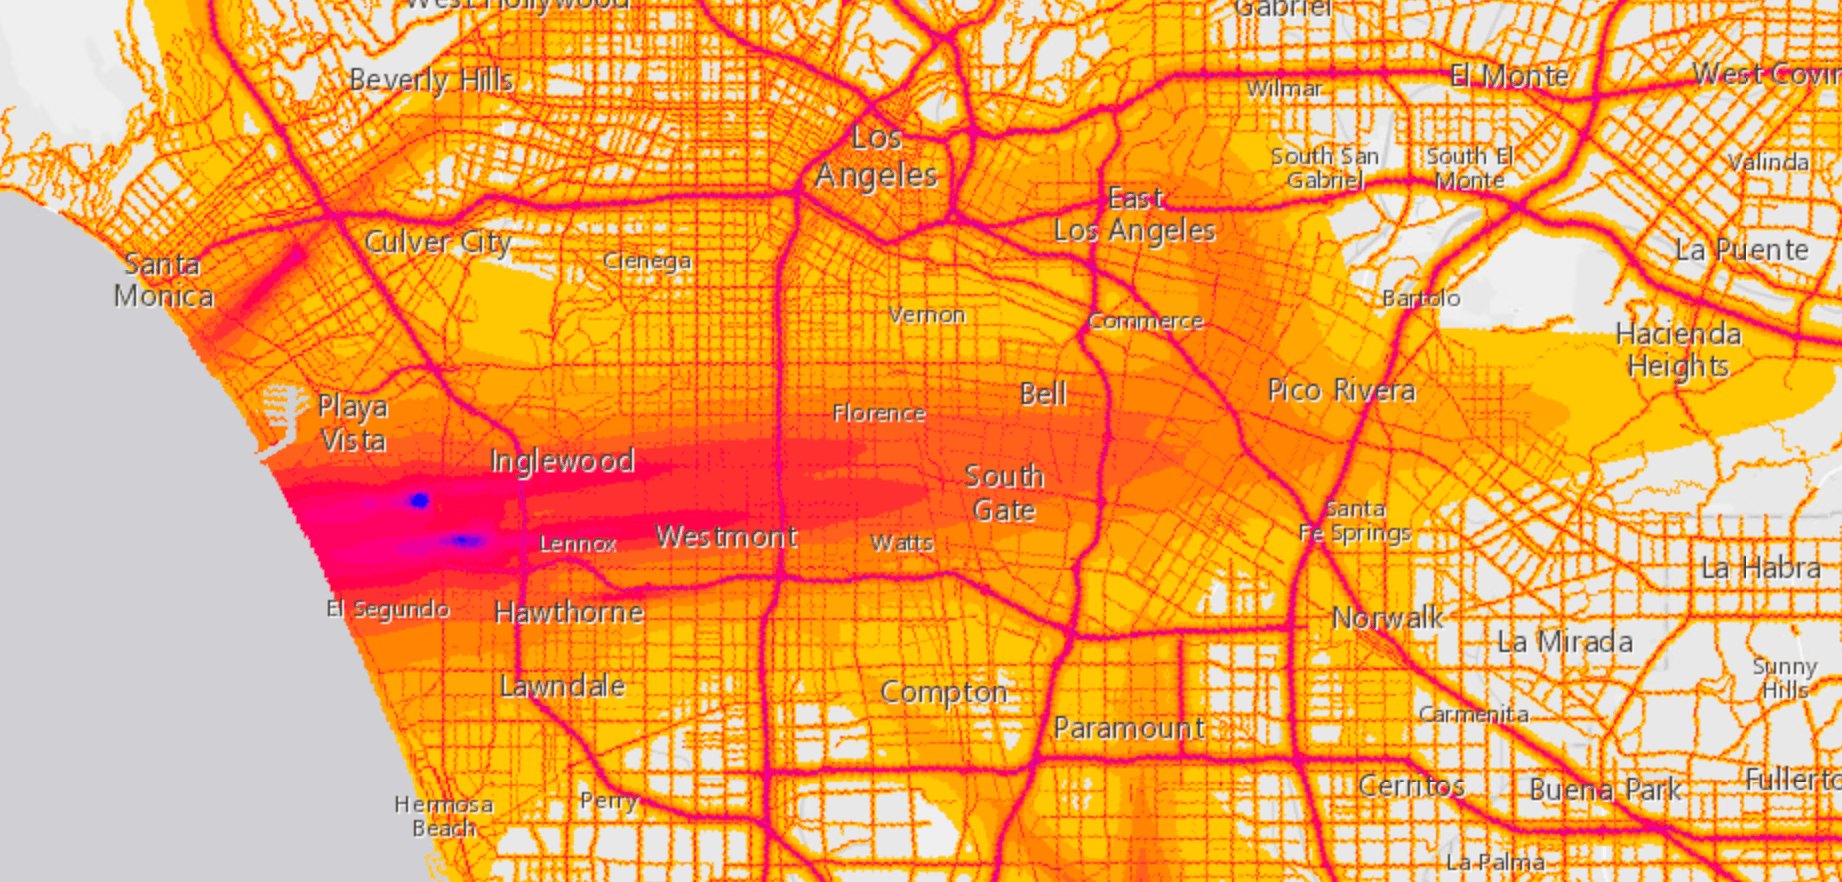
Not surprisingly, the loudest areas are freeways and airports, with airport flight paths being the loudest areas, but it's also interesting to see places like West Hollywood and Downtown get tons of road noise, apparently due to the density of the street systems there. You can see that same dynamic at work in New York City:

If you want to explore the map yourself, go here. Thanks to Laura J. Nelson on Twitter for sharing this map.


